log_policy
At first I thought about using the OWSM policy oracle/log_policy. This policy can be applied to an endpoint. The policy logs request and response messages. There is however not (without alteration of the policy) a way to correlate the request with the response message. See the image below. An ECID is logged, but the ECID can differ for a request and response. The ECID can also be the same for different requests in a call chain. Several HTTP or SOAP headers could potentially be used for this, but they have to be present in the request and in the response. This can require some work, especially if you want to add them in the request, since all consumers need to use these headers.

access.log
The access.log file stores by default some data on HTTP requests such as timestamp, HTTP status code, url and the size of the request. This can easily be expanded with the time which is required to process a request. You can configure this from the WebLogic Console. Go to your server, Logging, HTTP and click the Advanced button. Here you can add time-taken as a field to log in the Extended Logging Format Fields.
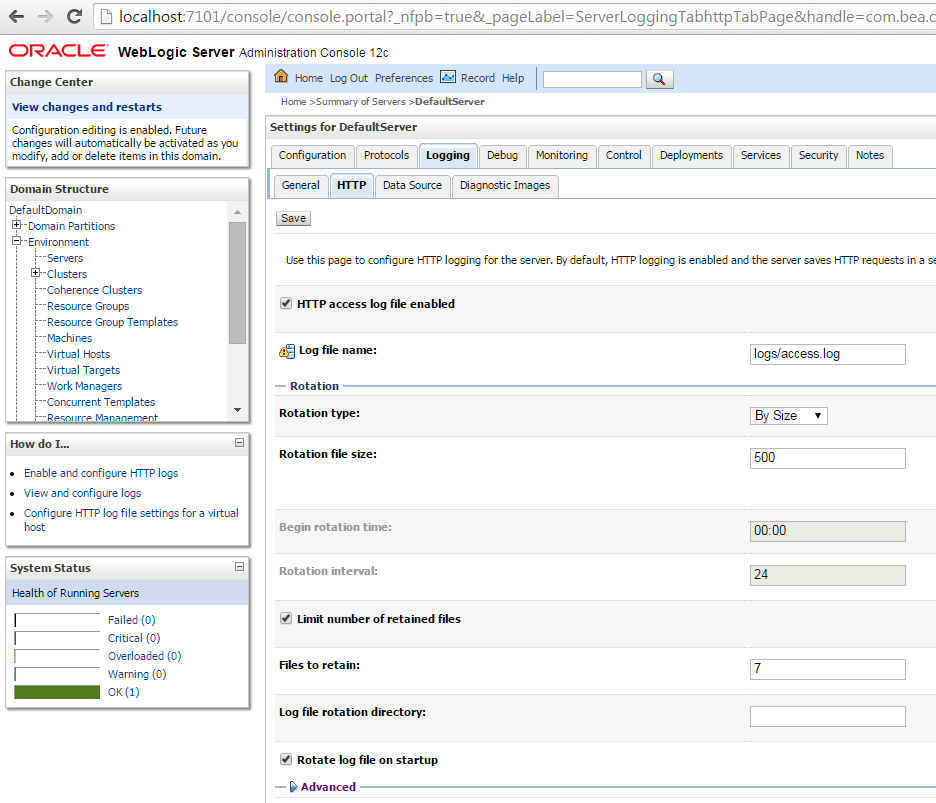

Please mind that the access.log file is buffered. See here on how you can change the buffering behavior. Your results will thus not immediately be available in Splunk. A single request will not show up until the access.log has exceeded the buffer size.
Processing the response times in Splunk
In order to make service response times available in Splunk, you first have to tell it how it can obtain the data. Splunk can use a lot of different sources of data. The TCP/UDP and HTTP options open up a port on the local machine, which is then monitored. This port has to be available. Monitoring the WebLogic port is thus not an option since WebLogic has claimed it already.

In this case I have used Files & Directories and pointed it to the location where the access.log file was stored. In my case <DOMAINDIR>\servers\<SERVERDIR>\logs\access.log.

After you have selected your source, you can query the file. In order to allow querying on specific fields, it is useful to extract them from the log line. Splunk makes it easy to create regular expressions for this by simply selecting the fields.

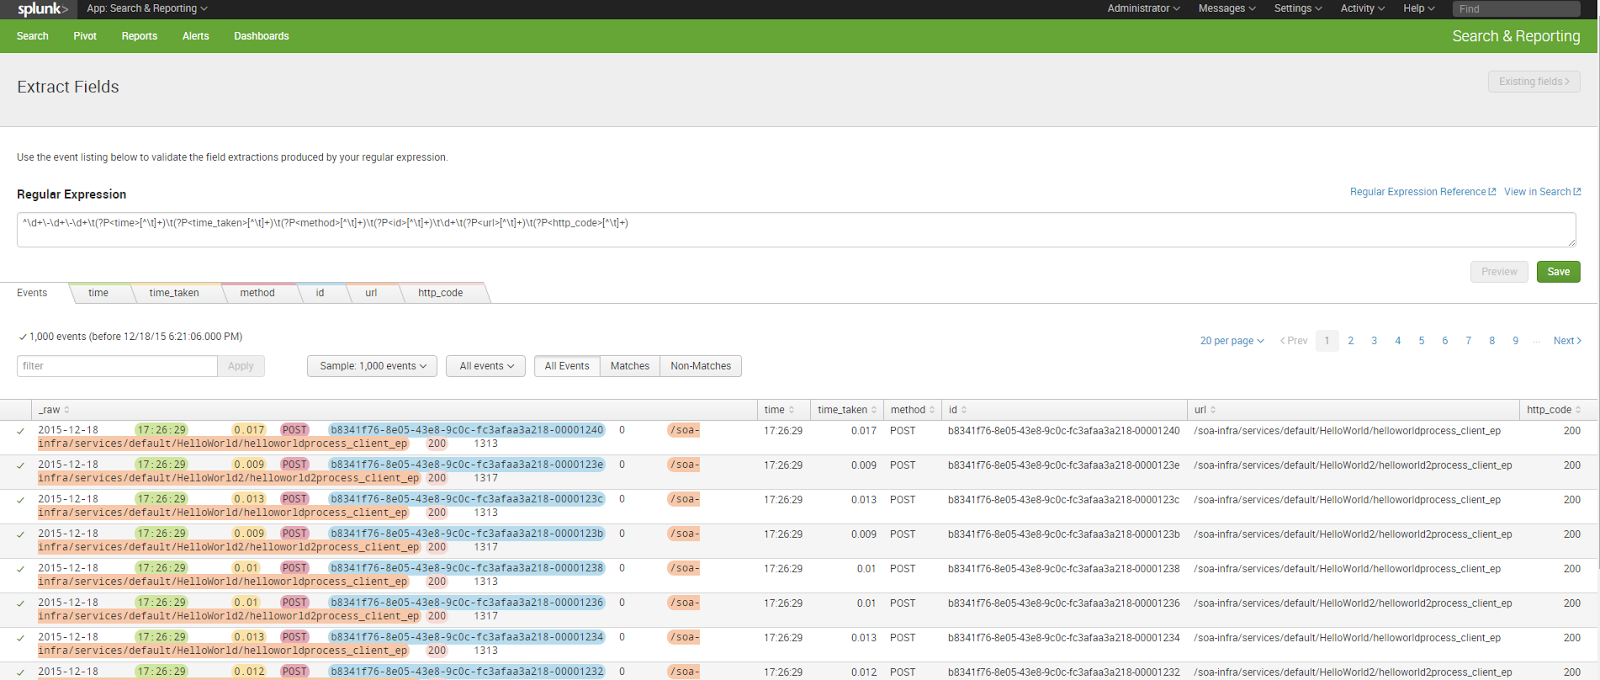
After you have done this, you can use a query like
| eval series=url | search url="/soa-infra/*_ep" | xyseries _time series time_taken | makecontinuous _time
To create a nice visualization, I create a series based on the url. Next I only want specific HTTP requests belonging to interesting services. I create an xyseries based on these values and make the time part continuous. The result of this is visible below;
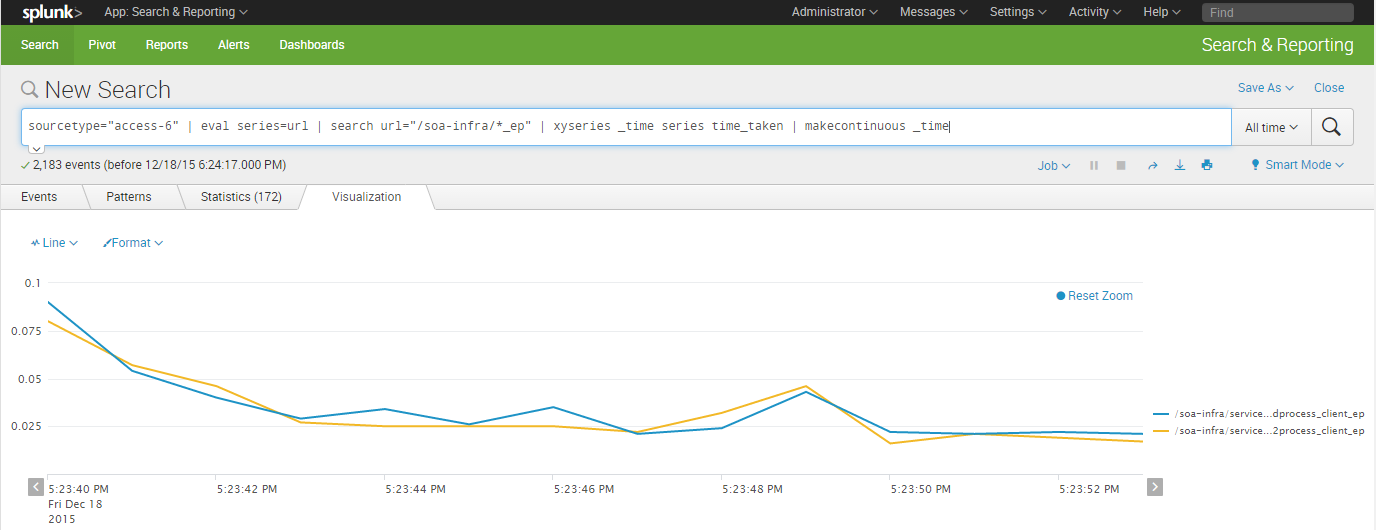
Based on these results you can of course create alerts to check against SLA's.
A query to trigger an alert can be for example;
| search time_taken > 1 | search url="/soa-infra/services/default/HelloWorld/helloworldprocess_client_ep"


Alerts can be executed once in a while or continuously.
Finally
The method used does not allow you to measure service response times of services using other protocols as HTTP(S). Direct invocations / local optimized / SOA-Direct requests for example will not be logged or JMS request/reply patterns. Alternatives (described below) such as IWS and the DMS Spy servlet do allow you to monitor these services. What does appear in the access.log is if you stay on the same host but tell a composite not to use local invocation on a binding. This can be done by setting two properties in the reference binding in the composite.xml file. These properties are also useful when running on a cluster to allow load balancing of requests.

Alternatives
There are of course many alternatives for monitoring performance and alerting. For (performance) monitoring of service response times you can look at the DMS Spy servlet or use Integration Workload Statistics (IWS). Other Oracle options are RUEI and BTM. For performance testing there are many tools available such as SmartBear SOAP-UI or Apache JMeter. For alerting, there are also several options available. You can use Service Bus default dashboards or for example configure alerts in the Enterprise Manager. It depends on your requirements which solution is the best fit. A more recent solution provided by Oracle is the Application Performance Monitoring Cloud Service which is definitely something worth to take a look at.
No comments:
Post a Comment