Showing posts with label performance. Show all posts

Saturday, July 17, 2021

Measure the Quality of your Source Code!

Quality is something which is hard to define. Different areas of expertise use their own definitions of what quality is. Without an objective standard which carries weight, anyone can claim to provide a quality product or service according to some standard. This makes it difficult to compare products and to formalize which characteristics a product or service needs to have. In this blog post I'll provide an introduction to ISO/IEC-5055 which is a quality standard which allows us to measure the quality of source code objectively.

Sunday, January 24, 2021

Python: A Google Translate service using Playwright

There are a lot of use-cases in which you might want to automate a web-browser. For example to automate tedious repetitive tasks or to perform automated tests of front-end applications. There are also several tools available to do this such as Selenium, Cypress and Puppeteer. Several blog posts and presentations by Lucas Jellema picked my interest in Playwright so I decided to give it a try. I'm not a great fan of JavaScript so I decided to go with Python for this one. I also did some tests with wrk, a simple yet powerful HTTP bench-marking tool, to get an indication about how Playwright would handle concurrency and was not disappointed.


Wednesday, April 8, 2020

Spring: Blocking vs non-blocking: R2DBC vs JDBC and WebFlux vs Web MVC

Spring Framework version 5, released in Sept 2017, introduced Spring WebFlux. A fully reactive stack. In Dec 2019 Spring Data R2DBC, a reactive relational database driver was released. In this blog post I'll show that at high concurrency, WebFlux and R2DBC perform better. They have better response times and higher throughput. As additional benefits, they use less memory and CPU per request processed and when leaving out JPA in case of R2DBC, your fat JAR becomes a lot smaller. At high concurrency using WebFlux and R2DBC is a good idea!


Friday, December 13, 2019

Java Microservices: What do you need to tweak to optimize throughput and response times

Performance tuning usually goes something like followed:
  • a performance problem occurs
  • an experienced person knows what is probably the cause and suggests a specific change
  • baseline performance is determined, the change is applied, and performance is measured again
  • if the performance has improved compared to the baseline, keep the change, else revert the change
  • if the performance is now considered sufficient, you're done. If not, return to the experienced person to ask what to change next and repeat the above steps
This entire process can be expensive. Especially in complex environments where the suggestion of an experienced person is usually a (hopefully well informed) guess. This probably will require quite some iterations for the performance to be sufficient. If you can make these guesses more accurate by augmenting this informed judgement, you can potentially tune more efficiently.

In this blog post I'll try to do just that. Of course a major disclaimer applies here since every application, environment, hardware, etc is different. The definition of performance and how to measure it is also something which you can have different opinions on. In short what I've done is look at many different variables and measuring response times and throughput of minimal implementations of microservices for every combination of those variables. I fed all that data to a machine learning model and asked the model which variables it used to do predictions of performance with. I also presented on this topic at UKOUG Techfest 2019 in Brighton, UK. You can view the presentation here.

Tuesday, September 3, 2019

Microservice framework startup time on different JVMs

When developing microservices, a fast startup time is useful. It can for example reduce the amount of time a rolling upgrade of instances takes and reduce build time thus shortening development cycles. When running your code using a 'serverless' framework such as for example Knative or FnProject, scaling and getting the first instance ready is faster.

When you want to reduce startup time, an obvious thing to look at is ahead of time (AOT) compilation such as provided as an early adopter plugin as part of GraalVM. Several frameworks already support this out of the box such as Helidon SE, Quarkus and Micronaut. Spring will probably follow with version 5.3 Q2 2020. AOT code, although it is fast to startup, still shows differences per framework. Which framework produces the native executable which is fastest to start?

If you need specific libraries which cannot be natively compiled (not even when using the Tracing Agent), using Java the old-fashioned JIT way is also an option. You will not achieve start-up times near AOT start-up times but by choosing the right framework and JVM, it can still be acceptable.

In this blog post I'll provide some measures which I did on start-up times of minimal implementations of several frameworks and an implementation with only Java SE. I've looked at both JIT and AOT (wherever this was possible) and ran the code on different JVMs.

Saturday, June 1, 2019

Performance! 3 reasons to stick to Java 8 for the moment

It is a smart thing to move to newer versions of Java! Support such as security updates and new features are just two of them but there are many more. Performance might be a reason to stick to Java 8 though. In this blog post I'll show some results of performance tests I have conducted showing Java 11 has slower startup times and slightly slower throughput compared to Java 8 when using the same Java code. Native images (a GraalVM feature) have greatly reduced startup time and memory usage at the cost of throughput. You can only compile Java 8 byte-code to a native image though (at the moment).

Saturday, March 16, 2019

Using Python to performancetest an Oracle DB

Performance testing is a topic with many opinions and complexities. You can not do it in a way which will make everyone happy. It is not straightforward to compare measures before and after a change. Environments are often not stable (without change in itself and its environment). When performing a test, the situation at the start or end of the test are also often not the same. For example the test might write data in a database.

There are various ways to look at performance. You can look at user experience, generate load similar to what application usage produces or you can do more basic things like query performance. What will you be looking at? Resource consumption and throughput are the usual suspects.

I'll look at a simple example in this blog post. I'll change database parameters and look at throughput of various actions which are regularly performed on databases. This takes away the complexity of distributed systems. I used a single Python script for this which can be downloaded here.


Summary of conclusions: Exposing database functionality using a DAD is not so much influenced by the tested settings. Setting FILESYSTEMIO_OPTIONS to SETALL improved the performance of almost all database actions. This has also been observed at different customers. Disabling Transparent HugePages and enabling the database to use HugePages seemed to have little effect. PL/SQL native compilation also did not cause a massive improvement. From the tested settings FILESYSTEMIO_OPTIONS is the easiest to apply. Query performance and actions involving a lot of data improved with all (and any of) these settings.

Saturday, December 8, 2018

JVM performance: OpenJ9 uses least memory. GraalVM most. OpenJDK distributions differ.

In a previous blog post I created a setup to compare JVM performance of several JVMs. I received some valuable feedback on the measures I conducted and requests to add additional JVMs. In this second post I'll look at some more JVMs and I've added some measures like process memory usage and startup time. Also I've automated the test and reduced the complexity of the setup by removing haproxy and testing a single JVM at a time.

Friday, November 23, 2018

Comparing JVM performance; Zulu, OpenJDK, Oracle JDK, GraalVM CE

There are many different choices for a JVM for your Java application. Which would be the best to use? This depends on various factors. Performance being an important one. Solid performance research however is difficult. In this blog post I'll describe a setup I created to perform tests on different JVMs at the same time and show some interesting results! I also looked at the effect of resource isolation (assigning specific CPUs and memory to the process). This effect was negligible. My test application consisted of a reactive (non-blocking) Spring Boot REST application and I've used Prometheus to poll the JVMs and Grafana for visualization.

Below is an image of the used setup. Everything was running in Docker containers except SoapUI.

Friday, June 2, 2017

Oracle SOA Suite: Want performance? Don't log so much and clean up your database!

The Oracle SOA Suite infrastructure, especially composites, use the database intensively. Not only are the process definitions stored in the database, also a lot of audit information gets written there. The SOA infrastructure database, if not well managed, will grow and will eventually have detrimental effects on performance. In this blog post I will give some quick suggestions that will help you increase performance of your SOA Suite infrastructure on the database side by executing some simple scripts. These are some suggestions I have seen work at different customers. Not only do they help managing the SOA Suite data in the database, they will also lead to better SOA Suite performance.


Monday, December 19, 2016

WebLogic Server: Automate obtaining performance metrics from DMS

Oracle provides the Dynamic Monitoring Service (DMS) as part of WebLogic Server which is extremely useful if you want to obtain aggregated data of an environment in case of for example a performance test. The data which can be obtained from DMS is extensive. This varies from average duration of service calls to JVM garbage collects to datasource statistics. DMS can be queried with WLST.  See for example here. On example script based on this can be found here. You can also directly go to a web-interface such as: http://<host>:<port>/dms/Spy. The DMS Spy servlet is by default only enabled on development environments but can be deployed on production environments (see here).

Obtaining data from DMS in an automated fashion, even with the WLST support, can be a challenge. In this blog I provide a Python 2.7 script which allows you to get information from the DMS and dump it in a CSV file for further processing. The script first logs and uses the obtained session information to download information from a specific table in XML. This XML is converted to CSV. The code does not require an Oracle Home (it is not WLST based). The purpose here is to provide an easy to use starting point which can be expanded to suit specific use-cases. The script works against WebLogic 11g and 12c environments (has been tested against 11.1.1.7 and 12.2.1). Do mind that the example URL given in the script obtains performance data on webservice operations. This works great on composites but not on Service Bus or JAX-WS services. You can download a general script here (which requires minimal changes to use) and a (more specific) script with examples of how to preprocess data in the script here.


Tuesday, August 9, 2016

Node.js: A simple pattern to increase perceived performance

The asynchronous nature of code running on Node.js provides many interesting options for service orchestration. In this example I will call two translation services (Google and SYSTRAN). I will call both of them quickly after each other (milliseconds). The first answer to be returned, will be the answer returned to the caller. The second answer will be ignored. I've used a minimal set of Node modules for this; http, url, request. Also I wrapped the translation API's to provide a similar interface which allows me to call them with the same request objects. You can download the code here. In the below picture this simple scenario is illustrated. I'm not going to talk about the event loop and the call stack. Watch this presentation for a nice elaboration on those.


Monday, January 25, 2016

Service implementation patterns and performance

Performance in service oriented environments is often an issue. This is usually caused by a combination of infrastructure, configuration and service efficiency. In this blog article I provide several suggestions to improve performance by using patterns in service implementations. The patterns are described globally since implementations can differ across specific use cases. Also I provide some suggestions on things to consider when implementing such a pattern. They are technology independent however the technology does of course play a role in the implementation options you have. This blog article was inspired by a session at AMIS by Lucas Jellema and additionally flavored by personal experience.


Saturday, December 19, 2015

A first look at Splunk. Monitor Oracle SOA Suite service response times

Measuring performance of services can be done in various ways. In this blog I will describe a method of measuring Oracle SOA service response times with Splunk a popular monitoring tool. In order to monitor service response times with Splunk, Splunk needs to obtain its data from somewhere. In this example I'll use the HTTP access log which I expand with a time-taken field. Disclaimer; my experience with Splunk is something like 2 hours. This might also be an indication of what can quickly be achieved with Splunk with little knowledge.


Monday, January 12, 2015

Oracle SOA Suite 12c: The Coherence Adapter

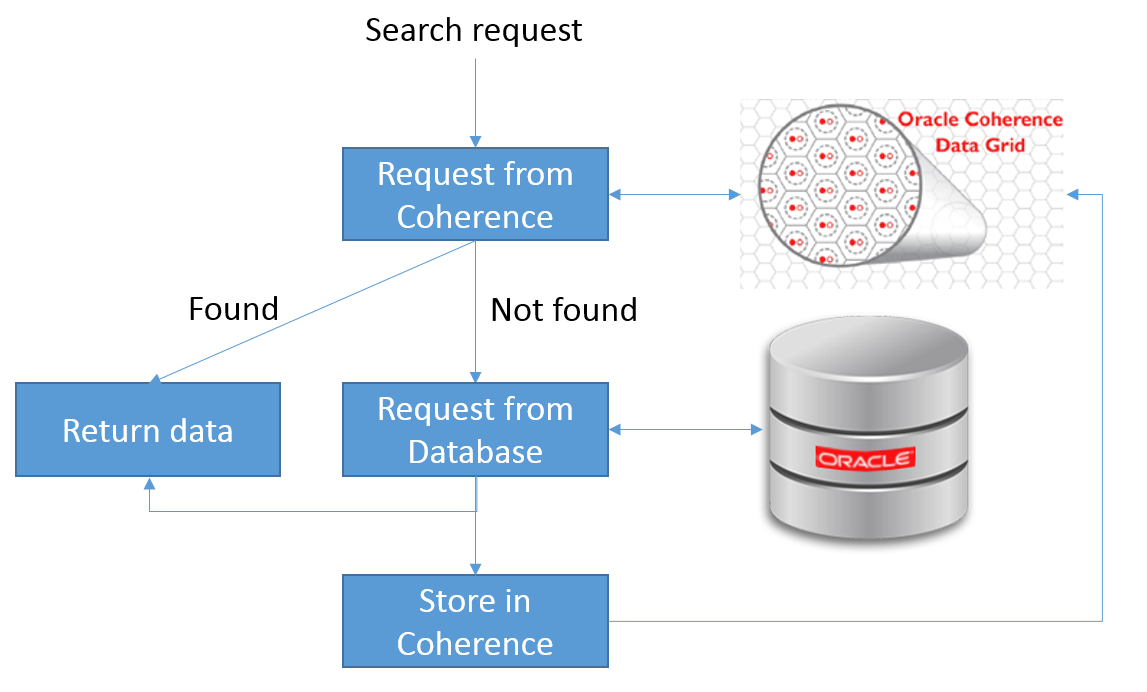
Oracle SOA Suite 12c ships with a new technology adapter, the Oracle CoherenceAdapter. This adapter allows easy integration with a Coherence Data Grid (a distributed cache). The excellent post by Antony Reynolds provides the information required to setup your Coherence cache and get started with the adapter. In this blog post I will describe a pattern which can be used to use Coherence Data Grid as a cache for a database table (or view, or...). Also I did some performance measures on the Oracle quickstart JDeveloper installation with Integrated Weblogic server with surprising results!


Friday, April 11, 2014

Controlling BPEL process flow at runtime

When using Oracle BPEL it is often desirable to allow a certain amount of configuration of the process flow at runtime. To allow configuration, properties/preferences/parameters can be used. These can be implemented in various ways. Lucas Jellema has described a method in the Oracle SOA Suite 11g Handbook (http://www.amazon.com/Oracle-SOA-Suite-Handbook-Press/dp/0071608974 page 252) for system parameters which uses Business Rules. In this blog post I compare three other methods; using Domain Value Maps, using BPEL preferences and using a database table. I look at performance, development, re-use potential, updating the preference at runtime and when to use which method.


Monday, January 20, 2014

JDBC from the Oracle Service Bus

There are different ways to do database calls from the Oracle Service Bus. In this blog post I look at several methods.

The methods looked at;
1 using an external webservice (without OSB)
2 using an external webservice proxied by the OSB
3 using the fn-bea:execute-sql function from the OSB
4 using the JCA DbAdapter from the OSB provided by Oracle as part of Oracle SOA Suite

Saturday, August 10, 2013

Book review; Oracle SOA Suite 11g Performance Tuning Cookbook

When implementing Oracle SOA 11g, performance is an often encountered topic. I have been involved at several customers in performance taskforces and I've read several books and a lot of Oracle documentation related to the topic. As such I was very interested in the book; Oracle SOA Suite 11g Performance Tuning Cookbook (http://bit.ly/12lrajU). I was curious as to whether this book would contribute much to the topic and if I would learn new and interesting things.

I can be a bit of a nit-picker at times. I personally have not written any books yet. For every chapter I've noted something positive and something which I probably would have done differently (or maybe when I know the reason why things are done a certain way I might agree on it). This is not meant as personal criticism to the writers as they clearly know what they are writing about.

Review per chapter

Chapter 1 Identifying problems
The first chapter is focused on how to identify problems. Problems can be high CPU usage (due to for example garbage collection) and for example slow database queries.

Positive
VisualVM was new to me and the analyses of stuck threads I might also use in the near future. JRockit Mission Control was already familiar (http://javaoraclesoa.blogspot.nl/2012/09/overview-monitoring-tools-oracle-jrockit.html) but it will be useful for others.

Negative
Because the book is in cookbook format and every recipe stands more or less on it's own, there is some repetition in for example how to use jps and jstat. I would have combined the recipes. What I was missing a bit here is concrete examples. How does the output of commands look. Also 'the survivor spaces and Eden' are introduced shortly which is a major topic in Chapter 5. The discussion on how to find problems with datasources could have been moved to Chapter 7.

Chapter 2 Monitoring Oracle SOA Suite
This chapter describes how VMWare's VFabric Hyperic HQ can be used to monitor Weblogic instances. Hyperic has an open source version; http://www.hyperic.com/hyperic-open-source-download.

Positive
The choice for Hyperic is well supported by arguments and the description on how to get it installed and configured is thorough. It looks like an interesting tool and works by installing an agent on the system to monitor. I'm currently using Nagios (http://www.nagios.org/) to monitor environments on a per (web)service level. I would have to try out Hyperic in order to determine if it can do that as well.

Negative
Monitoring is focused on OS/Weblogic health and not specific Oracle SOA Suite. The dms servlet is also discussed, however shortly. I would have left this out of the chapter and focus on Hyperic. If discussed, I would have expanded it a little such as for example add how it can be purged (for example at the end of http://javaoraclesoa.blogspot.nl/2012/08/issues-and-solutions-when-testing-and.html).

Chapter 3 Performance testing
JMeter is used to do performance testing on webservices.

Positive
Interesting topics were mainly distributed tests and the part on testing Amazon cloud services. Both were new to me.

Negative
I'm used to using SOAP UI for webservice tests and HermesJMS for JMS tests. Both are not discussed. It's most likely a matter of taste. The choice for JMeter is not supported by arguments. I missed performance testing of JMS queues here.

Chapter 4 JVM Memory
This chapter describes how the JVM uses memory and how this can be monitored/tuned.

Positive
This chapter contains a lot of explanation on the memory settings. This is something which I found often lacking in other books. 'A good rule of thumb is to stick to powers of 2', which is a good tip. Also; 'Note that by default the flag JAVA_USE_64BIT is set to false in %WL_HOME%\common\bin\commEnv.cmd.' is something I'll check out. The picture on JVM memory was clarifying. The division in JVM settings for JRockit and Hotspot is also useful.

Negative
This chapter also contains parts on JRockit Mission Control and VisualVM. Although these are very useful, it could have been combined with the part in Chapter 1.

Chapter 5 JVM Garbage Collection Tuning
The different garbage collection strategies for JRockit and Hotspot are explained here and how they can be tuned.

Positive
Disabling the RMI garbage collector was something new to me. Also disabling explicit garbage collection will be interesting to try and see if it makes a difference. Although applications shouldn't be using the System.gc() command, there are always programmers who sneak such code in.

Negative
Little to remark here. I liked reading the chapter. There was a bit more focus on Hotspot then on JRockit.

Chapter 6 Platform Tuning
This chapter describes options for tuning the platform. It is difficult to find a common denominator or focus point for the topics discussed in this chapter. The title fits.

Positive
JTA max transactions, HTTP accept backlog,  Stuck Thread Time, HugePages are settings I'll try out tuning at customers. Reducing OS swappiness is interesting as I've found that swap file usage can reduce performance dramatically. Also I got reminded that the OS also requires specific settings. I'll check if my customers adhere to the Oracle suggested settings. Of course there are also the more often mentioned settings such as tuning EJB timeouts present in this book.

Negative
First the stack is explained, SOA Suite runs on application server, application server runs on JVM, JVM runs on OS, OS runs on hardware. Then the chapter does not follow a top-down or bottom-up approach describing tuning options (or I've missed this). Suggesting to upgrade the JVM and use for example Java 1.7 is dangerous as I'm not sure Oracle supports that in combination with Oracle SOA Suite 11g (see; http://www.oracle.com/technetwork/middleware/ias/downloads/fusion-certification-100350.html). Describing tuning options on OS level could have been expanded a bit. For example I'm curious as to specific tuning options for different Linux distributions.

Chapter 7 Data Sources and JMS
This chapter described tuning of JMS and datasources.

Positive
Good to know; the settings for datasource testing can reduce stale connection issues. Also when tuning XA datasources, the database has to be tuned for this also; distributed_lock_timeout. The part on JMS tuning was relatively new to me but I am certain to use the knowledge when the need arises. Also a lot on JDBC datasource tuning was already familiar to me but useful for others.

Negative
It would have helped if the error messages which can occur when certain settings are incorrectly/sub-optimally configured, would have been added. This might make finding the right recipe to use when a certain problem occurs easier.

Chapter 8 BPEL and BPMN Engine Tuning
This chapter describes tuning of the BPEL and BPMN engine.

Positive
Not much new here for me. The most important settings are covered in my opinion. The tuning of the Db settings is something I'll go check at customers as the SOAINFRA performance is often a bottleneck.

Negative
Purging is a hot topic and could have been more thoroughly explained. It would have been nice if the 11.1.1.7 enhancements were also discussed but since it is relatively new, one can't blaim the writers for that. SOAINFRA tablespace defragmentation is not described (the rebuild index, shrink space, enable row movement kind of statements. for example http://javaoraclesoa.blogspot.nl/2012/06/increasing-bpel-performance.html). There were no BPMN engine specific tuning suggestions.

Chapter 9 Mediator and BAM
This chapter describes tuning options for the Mediator and BAM.

Positive
BAM tuning is not described often. A lot of familiar settings for the Mediator (also from http://javaoraclesoa.blogspot.nl/2013/07/oracle-soa-blackbelt-training-june-2013.html) but useful for people who are new to it.

Negative
It is a relatively short chapter and could have been combined with Chapter 10.

Chapter 10 Rules and Human Workflow
Optimization options for business rules and human workflow are discussed here. I have little experience with the components.

Positive
Choosing the right client to access the workflow component is interesting. Also how the rule engine can be used efficiently is something I will take with me when the need arises to use the component.

Negative
Not much to remark here except the same as in Chapter 9.

Chapter 11 SOA Application Design
Application design has a great impact on performance. Several suggestions are given in this chapter which can help.

Positive
Although this chapter does not appear to have been the main focus of the book, it does touch several of the more important areas to look for performance improvements.

Negative
I could write an entire book on the topic if time would allow me. Also I have done several measures in order to check whether specific settings actually increase performance. See for example http://javaoraclesoa.blogspot.nl/2012/09/suggestions-to-increase-bpel-performance.html. The training I've recently followed also gave several best practices on the topic; http://javaoraclesoa.blogspot.nl/2013/07/oracle-soa-blackbelt-training-june-2013.html. What I found lacking was programming practices. Which patterns to use and which to avoid and for example how to process large batches efficiently. I missed how to code processes with keeping transaction bounderies in mind (http://javaoraclesoa.blogspot.nl/2013/06/oracle-soa-11g-bpel-transaction.html).

Chapter 12 High Performance Configuration
This chapter gives suggestions for how a configuration can help increase performance. It is focused on OHS, JMS, Virtualization and hardware.

Positive
The parts on virtualization and hardware required I will use as arguments to talk to the people responsible for that part at my current customer that some improvements might be a good idea.

Negative
The JMS part could have been put in the JMS chapter. Clustering issues are barely touched such as local optimization settings and issues with the EIS adapters. I would have expected to find them in this chapter.

Conclusion

I liked this book. I have learned some new things I can use at customers. This book also does not repeat the manuals and other books much which also makes it interesting. It is the first book I have seen with focus completely on performance and tuning of Oracle SOA Suite 11g. Not only does the book contain the usual performance tips and several new ones but it also provides some suggestions for tuning in a virtualized environment (including a suggestion on how to measure cloud performance) and hardware.

I am no fan of the recipe format and would have grouped some things differently to describe a more bottom up or top down approach to tuning a SOA Suite installation. Especially JVM tuning gets a lot of attention. It is clear the authors know what they write about. Also the writing style makes this book an easy and enjoyable read. I did not get bored.

I missed a bit tuning of the OSB. Maybe some BPEL programming practices or patterns which help improving performance. What I also missed was tuning from a high level down to a single BPEL process; how to bridge the gap from JVM measures to BPEL process instances. There is not much focus on dehydration store maintenance which can also be an important factor in improving performance. Clustering issues are barely touched.

On the whole this was an interesting read with a lot of useful suggestions.

Wednesday, June 12, 2013

Oracle BPEL and Java. A comparison of different interaction options

When building BPEL processes in Oracle SOA Suite 11g, it sometimes happens some of the required functionality can't easily be created by using provided activities, flow control options and adapters. Often there are Java libraries available which can fill these gaps. This blog post provides an evaluation of different options for making interaction between BPEL and Java possible.

In the examples provided in this post, I'm using the JsonPath library (https://code.google.com/p/json-path/) inside a BPEL process. A usecase for this could be that a webclient calls the BPEL process with a JSON message and BPEL needs to extract fields from that message.

The Java code to execute, is the following;

package ms.testapp;

import com.jayway.jsonpath.JsonPath;

public class JsonPathUtils {
   
    public String ExecuteJsonPath(String jsonstring, String jsonpath) {
        String result = JsonPath.read(jsonstring, jsonpath).toString();
        return result;
    }
    
    public JsonPathUtils() {
        super();
    }
}

Of course small changes were necessary for the specific integration methods. I provided code samples at the end of this post for every method.

Integration methods

Embedding

Oracle has provided an extension activity for BPEL which allows Java embedding. By using this activity, Java code can be used directly from BPEL. The JsonPath libraries to use in the embedding activity can be put in different locations such as the domain library directory or be deployed as part of the BPEL process. Different classloaders will be involved. To check whether this matters I've tried both locations.

Performance
The Java call happens within the same component engine. Below are measures from when using JSON libraries deployed as part of the BPEL process (in SCA-INF/lib).
Below are measures from when putting the libraries in the domain library folder.
As you can see from the measures, the performance is very comparable. The location where the BPEL process gets it's classes from has no clear measurable consequences for the performance.

Re-use potential
When the libraries are placed in the domain lib folder, they can be reused by almost everything deployed on the applications server. This should be considered. When deploying as part of the composite, there is no re-use potential outside the composite except possibly indirectly by calling the composite.

Maintenance considerations
Embedded Java code is difficult to maintain and debug. When deployed as part of a BPEL process, changes to the library require redeployment of the process. When libraries are put in the domain library directory, changes to it, impact all applications using it and might require a restart.

XPath

XPath extension functions can be created and used in BPEL (+ other components) and JDeveloper. This is nicely described on; https://blogs.oracle.com/reynolds/entry/building_your_own_path.

Performance
The custom XPath library is included as part of the SOA infrastructure and does not leave this context. As can be seen, the performance is comparable to the Java embedding method.

Re-use potential
The reuse potential is high. The custom XPath library can be used in different locations/engines, dependent on the descriptor file.

Maintenance considerations
Reuse by different developers in JDeveloper requires minimal local configuration, but this allows GUI support of the custom library. There are no specific changes to BPEL code thus low maintenance overhead. Changing the library on the application server requires a restart of the server.

Spring component

The Java code can be called as a Spring component inside a composite. Here another component within the composite is called. The Java code is executed outside the BPEL engine.

Performance


Re-use potential
The following blog posts links to options with the Spring Framework; https://blogs.oracle.com/rammenon/entry/spring_framework_samples. When deployed inside a composite, reuse is limited to the composite. It is possible to define global Spring beans however, increasing re-use. The code can be created/debugged outside an embedding activity.

Maintenance considerations
The Spring component is relatively new to Oracle SOA Suite so some developers might not know how to work with this option yet. It's maintenance options are better then for the BPEL embedding activity. It is however still deployed as part of a composite.

External webservice

Java code can be externalized completely by for example providing it as a JAX-WS webservice or an EJB.

Performance
Performance is poor compared to the solutions described above. This is most likely due to the overhead of leaving soa-infra and the layers the message needs to pass to be able to be called from BPEL.

Re-use potential
Re-use potential is highest for this option. Even external processes can call the webservice so re-use is not limited to the same application server.

Maintenance considerations
Since the code is completely externalized, this option provides the best maintenance options. It can be developed separately by Java developers and provided to be used by an Oracle SOA developer. Also it can be replaced without requiring a server restart or composite redeploy.

Conclusion

The technical effort required to implement the different methods is comparable. Depending on the usecase/requirements, different options might be relevant. If performance is very important, embedding and XPath expressions might be your best choice. If maintenance and reuse are important, then externalizing the Java code in for example an external webservice might be the better option.

Summary of results
This is of course a personal opinion.


The used code with examples of all embedding options can be downloaded here; https://dl.dropboxusercontent.com/u/6693935/blog/TestJavaEmbedding.zip

Saturday, September 29, 2012

Suggestions to increase BPEL performance

The performance improvements suggested in this post are partially based on suggestions from the following book; https://beatechnologies.wordpress.com/2012/08/28/oracle-soa-suite-11g-administrators-handbook/

If you're interested in how you can improve SOA Suite performance (and of course several other aspects of SOA Suite administration), I suggest reading it.

I've used the Oracle VM which can be downloaded from http://www.oracle.com/technetwork/middleware/soasuite/learnmore/vmsoa-172279.html  .

Performance

I've written about some performance suggestions earlier; http://javaoraclesoa.blogspot.nl/2012/06/increasing-bpel-performance.html. Recently I've been doing several measures on different systems specifically concerning BPEL performance and have updated the above post to reflect those findings. In this post I will describe some new conclusions.

Test scenario's

I've created 5 test scenario's;
- a dummy scenarion (empty BPEL activity)
- a synchronous locally optimized webservice call
- an asynchronous locally optimized webservice call
- a synchronous not locally optimized webservice call
- a database call

Every scenario I've tested in a blocking invoke and nonblocking invoke setting. I've performed every test 200 times in a parallel executed for-each loop and measured the time by saving the start and end time in a database table.

When I'm talking about 'performance improved' or 'performance worsened, I'm talking about all scenarios. I've not found settings which improved the performance for one test scenario and decreased it for another.

I've found that testing just after a server restart caused performance measures to worsen. This is most likely due to the connection pools which need to create initial database connections (which is slow...). That's why I've done all tests at least 3 times. When testing on the Oracle VM I've purged the dehydration store after every run in order to get the same initial situation for the tests.

The settings which increased the performance on my systems can of course be system specific. If other people have different experiences concerning some of the settings described in this post, it will be interesting to know. Also keep in mind that the settings I've found to improve performance on my system, might worsen the performance if other test scenario's are used. You should always test the settings on your own system to make sure they have the desired result and to confirm system stability is not effected. I've not tested in a clustered environment.

I have results concerning the performance improvements for reducing audit and log levels. Reducing audit and other logging however and can make it harder to debug problems. Putting BPEL process audit logging on 'Development' however in a production environment is in my opinion overkill and should be avoided or only used for a short period in order to solve issues.

Results

Locally optimized webservice calls

Locally optimized calls are faster then not locally optimized calls (non locally optimized calls have among other things SOAP overhead). I've not yet looked at this behavior when working in a cluster with a load balancer. The following might be interesting and would suggest local optimizations does not work through a load balancer if the server URL differs from the load balancer URL; https://blogs.oracle.com/rammenon/entry/is_local_optimization_kicking.It would be interesting to test this and try and make it work in clustered environments since the performance increase for using locally optimized calls is (not statistically tested) significant (about 25%).

Asynchronous callbacks

I've seen in my measures that asynchronous callbacks are a lot slower (about 5 times) then synchronous interactions. This is of course to be expected since correlation data needs to be saved and incoming messages need to be matched to the correlation data. If performance is important and processes are short-running, I'd advice to avoid asynchronous constructions.

nonBlockingInvoke

Setting the nonBlockingInvoke property on a partnerlink caused a decrease in performance. This is something I had not expected based on; http://docs.oracle.com/cd/E23943_01/core.1111/e10108/bpel.htm#ASPER99890. In my tests however, the services were fast and did little. It could be that if slower services were used, an improvement could be measured when using the nonBlockingInvoke option. I have however not tested this.

Tuning datasources (SOAINFRA schema)

My measures concerning the performance changes achieved when increasing the connection pool size of the SOALocalTxDataSource and SOADataSource are not consistent. On the Oracle VM I found that increasing the connection pool size, performance was improved. When trying this setting on a customer system however, performance was worsened. On the Oracle VM, a dedicated XE database is installed which is setup to allow plenty of sessions. On the customer system, the database was not only installed on a (most likely physically) different server but also not dedicated; several SOA Suite instances used the same database for their dehydration store. At the customer, the database sessions parameter (see for example https://forums.oracle.com/forums/thread.jspa?threadID=898395) was found to be limiting in the past. An educated guess is that this caused the performance decrease on that system.

One can conclude from the above that only looking at JDBC datasource settings on the Weblogic server is not enough to achieve consistent improvement across environments. One should also look at the database settings.

JVM settings

The following settings increased performance on all systems;

In setSOADomainEnv.sh

Default
PORT_MEM_ARGS="-Xms768m -Xmx1536m"
New
PORT_MEM_ARGS="-Xms1536m -Xmx1536m -Xgcprio:throughput -XX:+HeapDumpOnOutOfMemoryError -XXtlasize:min=16k,preferred=128k,wasteLimit=8k"
The following settings decreased performance (from http://docs.oracle.com/cd/E13150_01/jrockit_jvm/jrockit/geninfo/diagnos/bestpractices.html);
-XXaggressive
-XXcallProfiling

BPEL Engine tuning

Threads
I've tried and measured several settings related to the BPEL engine. There are 4 settings related to the number of threads used by the BPEL Engine;
DispatcherSystemThreads
DispatcherEngineThreads   
DispatcherInvokeThreads   
DispatcherNonBlockInvokeThreads

Increasing them did not lead to performance improvements

AuditStorePolicy
I've also tried playing with the AuditStorePolicy setting. This caused errors or worsened performance when combined with several of the other audit settings I've tried (for example in combination with deferred audit logging as described in the post referred to in the introduction). I got the best results leaving this set to syncSingleWrite.

Coherence
Setting the QualityOfService from DirectWrite to CacheEnabled led to worsened performance.

OneWayDeliveryPolicy
Setting this from async.persist to async.cache improved performance

Asynchronous audit logging
See http://javaoraclesoa.blogspot.nl/2012/06/increasing-bpel-performance.html. It improves performance but check the log files to see if the audit store does not encoutner unique key constraints.

I've not tried altering audit thresholds. This can also lead to performance improvements.

Process improvements

The process of using, monitoring and maintaining the SOA Suite installation is maybe even more important in increasing the performance then providing technical tweaks.

Based on the topics discussed in the Administrators handbook (https://beatechnologies.wordpress.com/2012/08/28/oracle-soa-suite-11g-administrators-handbook/) there are several activities which are considered to be part of the SOA Administrators responsibilities. This might be interesting for customers to consider. If for example a SOA Administrator has little background in application server maintenance or the SOA Suite in specific, there's a high probability project developers are more knowledgeable in some area's. This often leads to shift of responsibilities to developers.

Some of the tasks mentioned as part of the SOA Administrators job are listed below. These usually end up being done by developers.
- automating composite management and structuring composite deployments using ant scripts
- using and managing configuration plans
- administration of services, engines and MDS
- tuning SOA Suite 11g (operating system, application server, SOA infrastructure, database connections, dehydration store)
- monitoring (sometimes 'it's up and running!' is not enough...)

Other suggestions

The book contains several other suggestions for increasing performance. Interesting is also how the SOAINFRA database/schema can be tweaked. I've however not tested/measured this.

Since BPEL often uses services from different systems, tweaking those services can increase the performance of the process as a whole. Most noteworthy here are of course databases and JDBC settings.