Implementation
Setup
To illustrate debugging
I've used a simple webservice to illustrate the above;
package ms.testapp.services;
import java.util.Calendar;
import javax.jws.WebService;
import javax.jws.WebMethod;
import javax.jws.WebParam;
/**
*
* @author Maarten
*/
@WebService(serviceName = "HelloWorldService")
public class HelloWorldService {
/**
* This is a sample web service operation
*/
@WebMethod(operationName = "hello")
public String hello(@WebParam(name = "name") String txt) throws Exception {
Calendar myCal = Calendar.getInstance();
if ((myCal.getTimeInMillis() % 10) == 0) {
throw new Exception("Not right now !");
}
if (txt.equals("Maarten")) {
throw new Exception("Maarten is not allowed !");
}
return "Hello " + txt + " !";
}
}
This webservice will throw exceptions in case the supplied input is Maarten and during every 10th millisecond . This allows me to illustrate both the debugger and SOAP UI usage. After I've deployed the application, the URL of the WSDL of the webservice in my case is;
http://[server]:[port]/HelloWorldApp/HelloWorldService?wsdl
You can download the sample WAR file here; https://dl.dropboxusercontent.com/u/6693935/blog/HelloWorldApp.war
Using the debugger in Netbeans
Netbeans has a build-in remote debugger. To use this debugger, first debugging needs to be activated on the application server by adding a JVM parameter (and restarting the server). This can be done in the Weblogic console by going to the Servers item in the 'Domain Structure'. Click on the relevant server and go to the 'Server Start' tab. Here you can add under 'Arguments';
-Xrunjdwp:server=y,suspend=n,transport=dt_socket,address=12998
After the server has been restarted, you can set a breakpoint in Netbeans by left clicking the relevant line number;

Next you can attach a debugger in Netbeans.


Now you can test your project in SOAP UI. First use any name. The Netbeans debugger is not triggered. Next use Maarten. The breakpoint is triggered.

SOAP UI will wait for a response (within a timeout). The debugger is triggered and you can see the contents of variables by hovering over them with the mouse. When you press the green play button, the program will continue and you will get the response in SOAP UI.

SOAP UI Xpath expression testing the response.
If you have defined a project in SOAP UI based on the WSDL of the service,you can create a TestCase.

Add an assertion;
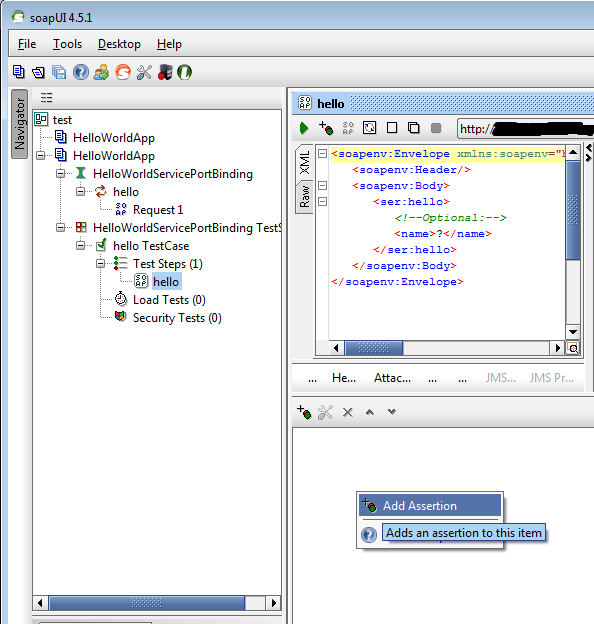
Property Content, XPath Match. Define your namespaces and your XPath expression. Click the 'Select from current' button to test your query.

Now create a new load test and put some load on the service;

As you can see, there are a lot of errors. This is as expected since every 10ms, requests will fail with an exception.
Conclusion
Often it is not enough to put log statements in your code to solve problems. Using SOAP UI to do a load test and check the response can help determine the behavior of a service under load. Also using a debugger to track exactly what happens on the server can provide additional information on the cause of errors.
Do not forget that on a production environment, the server should (of course) not be in debug mode and log messages should be sufficient for the people responsible for application maintenance to solve problems.
No comments:
Post a Comment