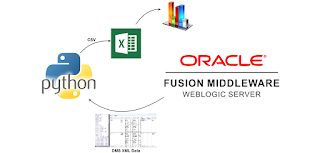
Oracle provides the Dynamic Monitoring Service (DMS) as part of WebLogic Server which is extremely useful if you want to obtain aggregated data of an environment in case of for example a performance test. The data which can be obtained from DMS is extensive. This varies from average duration of service calls to JVM garbage collects to datasource statistics. DMS can be queried with WLST. See for example here. On example script based on this can be found here. You can also directly go to a web-interface such as: http://<host>:<port>/dms/Spy. The DMS Spy servlet is by default only enabled on development environments but can be deployed on production environments (see here).
Obtaining data from DMS in an automated fashion, even with the WLST support, can be a challenge. In this blog I provide a Python 2.7 script which allows you to get information from the DMS and dump it in a CSV file for further processing. The script first logs and uses the obtained session information to download information from a specific table in XML. This XML is converted to CSV. The code does not require an Oracle Home (it is not WLST based). The purpose here is to provide an easy to use starting point which can be expanded to suit specific use-cases. The script works against WebLogic 11g and 12c environments (has been tested against 11.1.1.7 and 12.2.1). Do mind that the example URL given in the script obtains performance data on webservice operations. This works great on composites but not on Service Bus or JAX-WS services. You can download a general script here (which requires minimal changes to use) and a (more specific) script with examples of how to preprocess data in the script here.
