If you do not want to use the EM / SB console or have the issues with the filestore, there is an alternative. Pipeline alerts can produce SNMP traps. SNMP traps can be forwarded by a WebLogic SNMP Agent to an SNMP Manager. This manager can store the SNMP traps in a file and Splunk can monitor the file. Splunk makes searching alerts and visualizing them easy. In this blog I will describe the steps needed to get a minimal setup with SNMP traps going and how to see the pipeline alerts in Splunk.
Service Bus
Create an AlertDestination in JDeveloper
Make sure you have Alert Logging and Reporting disabled and SNMP Trap enabled in the Alert Destination you are using in your Service Bus project. For testing purposes you can first keep the Alert Logging on to also see the alerts in the EM or SB Console.
Add the Alert action to a pipeline
In this example I'm logging the entire body of the message. You might also consider logging the (SOAP) header in a more elaborate setup if it contains relevant information. Configure the alert to use the alert destination.
WebLogic Server
Configure an SNMP Manager
On Ubuntu Linux installing an SNMP Manager and running it is as easy as:
sudo apt-get install snmptrapd
Update /etc/snmp/snmptrapd.conf
Uncomment the line: authCommunity log,execute,net public
The authCommunity public is the same as set in the WebLogic SNMP Agent configuration below for Community Based Access, Community Prefix.
sudo snmptrapd -Lf /var/log/snmp-traps
This runs an SNMP Manager on UDP port 162 and puts the output in a file called /var/log/snmp-traps. On my Ubuntu machine, snmptrapd logging ended up in /var/log/syslog.
Configure the SNMP Agent
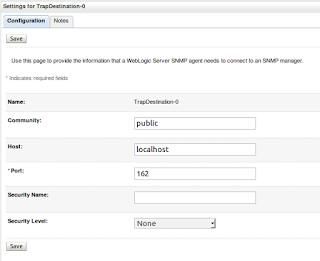
Configuring an SNMP Agent on WebLogic Server is straightforward and you do not need to restart the server after you have done this configuration. Go to Diagnostics, SNMP and enable the SNMP Agent for the domain. Do mind the following pieces of configuration though:
On Linux a non-privileged user is not allowed to run servers under port 1024. I've added a zero after the port numbers to avoid the issue of the SNMP Agent not being able to start (see here).
For the Trap Destination specify the host/port where the SNMP Manager (snmptrapd) is running.
Test the setup
If you want to test the configuration of the agent, Service Bus alert and AlertDestination, you can use the following (inspired by this).
First run setDomainEnv.cmd or setDomainEnv.sh; weblogic.jar must be in the CLASSPATH.
java weblogic.diagnostics.snmp.cmdline.Manager SnmpTrapMonitor -p 162
The port is the port given in the trap destination. Use a port above 1024 if you do not have permissions to create a server running on a lower port.
Now if you call your service with the pipeline alert and alert destination configured correctly and you have configured the SNMP Agent in WebLogic Server correctly, you will see the SNMP Manager producing output in the console of the SNMP trap which has been caught. If you do not see any output, check the WebLogic server logs for SNMP related errors. If this is working correctly, you can change the trap destination to point to snmptrapd (which of course needs to be running). If you do not see pipeline alerts from snmptrapd in /var/log/snmp-traps, you might have a connectivity issue to snmptrapd or you have not configured snmptrapd correctly. For example, you forgot to edit /etc/snmp/snmptrapd.conf. Also check /var/log/syslog for snmptrapd messages.
Splunk
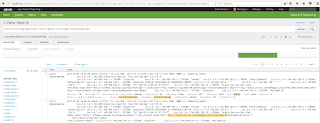
It is easy to add a file as a source in Splunk. OOTB you get results like below. As you can see, the entire message is present in the log including additional data such as the pipeline, the location of the alert and the domain.
You can read more about the Splunk setup here.
Some notes
- Do you want to use pipeline alerts? The Alert activity in Service Bus is blocking; processing of the pipeline will continue after the Alert has been delivered (stored in the persistent store or after having produced an SNMP trap). This can delay service calls (in contrast to Report activities). Also there have been reports of memory leaks. See: 'OSB Alert Log Activities Generating Memory Leak on WebLogic Server (Doc ID 1536484.1)' on Oracle support.
- Use a single alert destination for all your services. This makes changing the alert configuration more easy.
- Think about your alert levels. You do not want alerts for everything all the time since it has a performance impact.
- Configure logrotate for the SNMP Manager trap file. Otherwise it might become very large and difficult to parse. See here for some examples.
- Consider running snmptrapd on another host as the WebLogic Server. In case of large numbers of pipeline alerts, it will cause disk IO and potentially more than the regular persistent store because of its plain text format. I have not checked if this causes a delay in Service Bus pipeline processing. My guess is that producing alerts and sending it to the SNMP Agent might be part of the same thread which is used for processing the Service Bus pipeline, but sending SNMP traps from the SNMP Agent to the SNMP Manager is not; will not delay the Service Bus process. Do some performance tests before making decisions on a local or remote snmptrapd setup.
- Which SNMP Manager do you want to use? I'm using snmptrapd because it is easy to produce files which can be read by Splunk but with this (Service Bus, WebLogic Server) setup you can of course easily use any other SNMP Manager instead of snmptrapd icm Splunk. For example Enterprise Manager Cloud Control (see here).
- SNMP traps are UDP messages. If send and not received, they might be lost. As a consequence you might lose pipeline alerts
- Pipeline alerts are also visible in the server log. Splunk can monitor the server log. This is an easy alternative.


No comments:
Post a Comment