Showing posts with label JVM. Show all posts

Friday, December 13, 2019

Java Microservices: What do you need to tweak to optimize throughput and response times

Performance tuning usually goes something like followed:
  • a performance problem occurs
  • an experienced person knows what is probably the cause and suggests a specific change
  • baseline performance is determined, the change is applied, and performance is measured again
  • if the performance has improved compared to the baseline, keep the change, else revert the change
  • if the performance is now considered sufficient, you're done. If not, return to the experienced person to ask what to change next and repeat the above steps
This entire process can be expensive. Especially in complex environments where the suggestion of an experienced person is usually a (hopefully well informed) guess. This probably will require quite some iterations for the performance to be sufficient. If you can make these guesses more accurate by augmenting this informed judgement, you can potentially tune more efficiently.

In this blog post I'll try to do just that. Of course a major disclaimer applies here since every application, environment, hardware, etc is different. The definition of performance and how to measure it is also something which you can have different opinions on. In short what I've done is look at many different variables and measuring response times and throughput of minimal implementations of microservices for every combination of those variables. I fed all that data to a machine learning model and asked the model which variables it used to do predictions of performance with. I also presented on this topic at UKOUG Techfest 2019 in Brighton, UK. You can view the presentation here.

Saturday, June 1, 2019

Performance! 3 reasons to stick to Java 8 for the moment

It is a smart thing to move to newer versions of Java! Support such as security updates and new features are just two of them but there are many more. Performance might be a reason to stick to Java 8 though. In this blog post I'll show some results of performance tests I have conducted showing Java 11 has slower startup times and slightly slower throughput compared to Java 8 when using the same Java code. Native images (a GraalVM feature) have greatly reduced startup time and memory usage at the cost of throughput. You can only compile Java 8 byte-code to a native image though (at the moment).

Saturday, December 8, 2018

JVM performance: OpenJ9 uses least memory. GraalVM most. OpenJDK distributions differ.

In a previous blog post I created a setup to compare JVM performance of several JVMs. I received some valuable feedback on the measures I conducted and requests to add additional JVMs. In this second post I'll look at some more JVMs and I've added some measures like process memory usage and startup time. Also I've automated the test and reduced the complexity of the setup by removing haproxy and testing a single JVM at a time.

Saturday, August 10, 2013

Book review; Oracle SOA Suite 11g Performance Tuning Cookbook

When implementing Oracle SOA 11g, performance is an often encountered topic. I have been involved at several customers in performance taskforces and I've read several books and a lot of Oracle documentation related to the topic. As such I was very interested in the book; Oracle SOA Suite 11g Performance Tuning Cookbook (http://bit.ly/12lrajU). I was curious as to whether this book would contribute much to the topic and if I would learn new and interesting things.

I can be a bit of a nit-picker at times. I personally have not written any books yet. For every chapter I've noted something positive and something which I probably would have done differently (or maybe when I know the reason why things are done a certain way I might agree on it). This is not meant as personal criticism to the writers as they clearly know what they are writing about.

Review per chapter

Chapter 1 Identifying problems
The first chapter is focused on how to identify problems. Problems can be high CPU usage (due to for example garbage collection) and for example slow database queries.

Positive
VisualVM was new to me and the analyses of stuck threads I might also use in the near future. JRockit Mission Control was already familiar (http://javaoraclesoa.blogspot.nl/2012/09/overview-monitoring-tools-oracle-jrockit.html) but it will be useful for others.

Negative
Because the book is in cookbook format and every recipe stands more or less on it's own, there is some repetition in for example how to use jps and jstat. I would have combined the recipes. What I was missing a bit here is concrete examples. How does the output of commands look. Also 'the survivor spaces and Eden' are introduced shortly which is a major topic in Chapter 5. The discussion on how to find problems with datasources could have been moved to Chapter 7.

Chapter 2 Monitoring Oracle SOA Suite
This chapter describes how VMWare's VFabric Hyperic HQ can be used to monitor Weblogic instances. Hyperic has an open source version; http://www.hyperic.com/hyperic-open-source-download.

Positive
The choice for Hyperic is well supported by arguments and the description on how to get it installed and configured is thorough. It looks like an interesting tool and works by installing an agent on the system to monitor. I'm currently using Nagios (http://www.nagios.org/) to monitor environments on a per (web)service level. I would have to try out Hyperic in order to determine if it can do that as well.

Negative
Monitoring is focused on OS/Weblogic health and not specific Oracle SOA Suite. The dms servlet is also discussed, however shortly. I would have left this out of the chapter and focus on Hyperic. If discussed, I would have expanded it a little such as for example add how it can be purged (for example at the end of http://javaoraclesoa.blogspot.nl/2012/08/issues-and-solutions-when-testing-and.html).

Chapter 3 Performance testing
JMeter is used to do performance testing on webservices.

Positive
Interesting topics were mainly distributed tests and the part on testing Amazon cloud services. Both were new to me.

Negative
I'm used to using SOAP UI for webservice tests and HermesJMS for JMS tests. Both are not discussed. It's most likely a matter of taste. The choice for JMeter is not supported by arguments. I missed performance testing of JMS queues here.

Chapter 4 JVM Memory
This chapter describes how the JVM uses memory and how this can be monitored/tuned.

Positive
This chapter contains a lot of explanation on the memory settings. This is something which I found often lacking in other books. 'A good rule of thumb is to stick to powers of 2', which is a good tip. Also; 'Note that by default the flag JAVA_USE_64BIT is set to false in %WL_HOME%\common\bin\commEnv.cmd.' is something I'll check out. The picture on JVM memory was clarifying. The division in JVM settings for JRockit and Hotspot is also useful.

Negative
This chapter also contains parts on JRockit Mission Control and VisualVM. Although these are very useful, it could have been combined with the part in Chapter 1.

Chapter 5 JVM Garbage Collection Tuning
The different garbage collection strategies for JRockit and Hotspot are explained here and how they can be tuned.

Positive
Disabling the RMI garbage collector was something new to me. Also disabling explicit garbage collection will be interesting to try and see if it makes a difference. Although applications shouldn't be using the System.gc() command, there are always programmers who sneak such code in.

Negative
Little to remark here. I liked reading the chapter. There was a bit more focus on Hotspot then on JRockit.

Chapter 6 Platform Tuning
This chapter describes options for tuning the platform. It is difficult to find a common denominator or focus point for the topics discussed in this chapter. The title fits.

Positive
JTA max transactions, HTTP accept backlog,  Stuck Thread Time, HugePages are settings I'll try out tuning at customers. Reducing OS swappiness is interesting as I've found that swap file usage can reduce performance dramatically. Also I got reminded that the OS also requires specific settings. I'll check if my customers adhere to the Oracle suggested settings. Of course there are also the more often mentioned settings such as tuning EJB timeouts present in this book.

Negative
First the stack is explained, SOA Suite runs on application server, application server runs on JVM, JVM runs on OS, OS runs on hardware. Then the chapter does not follow a top-down or bottom-up approach describing tuning options (or I've missed this). Suggesting to upgrade the JVM and use for example Java 1.7 is dangerous as I'm not sure Oracle supports that in combination with Oracle SOA Suite 11g (see; http://www.oracle.com/technetwork/middleware/ias/downloads/fusion-certification-100350.html). Describing tuning options on OS level could have been expanded a bit. For example I'm curious as to specific tuning options for different Linux distributions.

Chapter 7 Data Sources and JMS
This chapter described tuning of JMS and datasources.

Positive
Good to know; the settings for datasource testing can reduce stale connection issues. Also when tuning XA datasources, the database has to be tuned for this also; distributed_lock_timeout. The part on JMS tuning was relatively new to me but I am certain to use the knowledge when the need arises. Also a lot on JDBC datasource tuning was already familiar to me but useful for others.

Negative
It would have helped if the error messages which can occur when certain settings are incorrectly/sub-optimally configured, would have been added. This might make finding the right recipe to use when a certain problem occurs easier.

Chapter 8 BPEL and BPMN Engine Tuning
This chapter describes tuning of the BPEL and BPMN engine.

Positive
Not much new here for me. The most important settings are covered in my opinion. The tuning of the Db settings is something I'll go check at customers as the SOAINFRA performance is often a bottleneck.

Negative
Purging is a hot topic and could have been more thoroughly explained. It would have been nice if the 11.1.1.7 enhancements were also discussed but since it is relatively new, one can't blaim the writers for that. SOAINFRA tablespace defragmentation is not described (the rebuild index, shrink space, enable row movement kind of statements. for example http://javaoraclesoa.blogspot.nl/2012/06/increasing-bpel-performance.html). There were no BPMN engine specific tuning suggestions.

Chapter 9 Mediator and BAM
This chapter describes tuning options for the Mediator and BAM.

Positive
BAM tuning is not described often. A lot of familiar settings for the Mediator (also from http://javaoraclesoa.blogspot.nl/2013/07/oracle-soa-blackbelt-training-june-2013.html) but useful for people who are new to it.

Negative
It is a relatively short chapter and could have been combined with Chapter 10.

Chapter 10 Rules and Human Workflow
Optimization options for business rules and human workflow are discussed here. I have little experience with the components.

Positive
Choosing the right client to access the workflow component is interesting. Also how the rule engine can be used efficiently is something I will take with me when the need arises to use the component.

Negative
Not much to remark here except the same as in Chapter 9.

Chapter 11 SOA Application Design
Application design has a great impact on performance. Several suggestions are given in this chapter which can help.

Positive
Although this chapter does not appear to have been the main focus of the book, it does touch several of the more important areas to look for performance improvements.

Negative
I could write an entire book on the topic if time would allow me. Also I have done several measures in order to check whether specific settings actually increase performance. See for example http://javaoraclesoa.blogspot.nl/2012/09/suggestions-to-increase-bpel-performance.html. The training I've recently followed also gave several best practices on the topic; http://javaoraclesoa.blogspot.nl/2013/07/oracle-soa-blackbelt-training-june-2013.html. What I found lacking was programming practices. Which patterns to use and which to avoid and for example how to process large batches efficiently. I missed how to code processes with keeping transaction bounderies in mind (http://javaoraclesoa.blogspot.nl/2013/06/oracle-soa-11g-bpel-transaction.html).

Chapter 12 High Performance Configuration
This chapter gives suggestions for how a configuration can help increase performance. It is focused on OHS, JMS, Virtualization and hardware.

Positive
The parts on virtualization and hardware required I will use as arguments to talk to the people responsible for that part at my current customer that some improvements might be a good idea.

Negative
The JMS part could have been put in the JMS chapter. Clustering issues are barely touched such as local optimization settings and issues with the EIS adapters. I would have expected to find them in this chapter.

Conclusion

I liked this book. I have learned some new things I can use at customers. This book also does not repeat the manuals and other books much which also makes it interesting. It is the first book I have seen with focus completely on performance and tuning of Oracle SOA Suite 11g. Not only does the book contain the usual performance tips and several new ones but it also provides some suggestions for tuning in a virtualized environment (including a suggestion on how to measure cloud performance) and hardware.

I am no fan of the recipe format and would have grouped some things differently to describe a more bottom up or top down approach to tuning a SOA Suite installation. Especially JVM tuning gets a lot of attention. It is clear the authors know what they write about. Also the writing style makes this book an easy and enjoyable read. I did not get bored.

I missed a bit tuning of the OSB. Maybe some BPEL programming practices or patterns which help improving performance. What I also missed was tuning from a high level down to a single BPEL process; how to bridge the gap from JVM measures to BPEL process instances. There is not much focus on dehydration store maintenance which can also be an important factor in improving performance. Clustering issues are barely touched.

On the whole this was an interesting read with a lot of useful suggestions.

Saturday, September 29, 2012

Suggestions to increase BPEL performance

The performance improvements suggested in this post are partially based on suggestions from the following book; https://beatechnologies.wordpress.com/2012/08/28/oracle-soa-suite-11g-administrators-handbook/

If you're interested in how you can improve SOA Suite performance (and of course several other aspects of SOA Suite administration), I suggest reading it.

I've used the Oracle VM which can be downloaded from http://www.oracle.com/technetwork/middleware/soasuite/learnmore/vmsoa-172279.html  .

Performance

I've written about some performance suggestions earlier; http://javaoraclesoa.blogspot.nl/2012/06/increasing-bpel-performance.html. Recently I've been doing several measures on different systems specifically concerning BPEL performance and have updated the above post to reflect those findings. In this post I will describe some new conclusions.

Test scenario's

I've created 5 test scenario's;
- a dummy scenarion (empty BPEL activity)
- a synchronous locally optimized webservice call
- an asynchronous locally optimized webservice call
- a synchronous not locally optimized webservice call
- a database call

Every scenario I've tested in a blocking invoke and nonblocking invoke setting. I've performed every test 200 times in a parallel executed for-each loop and measured the time by saving the start and end time in a database table.

When I'm talking about 'performance improved' or 'performance worsened, I'm talking about all scenarios. I've not found settings which improved the performance for one test scenario and decreased it for another.

I've found that testing just after a server restart caused performance measures to worsen. This is most likely due to the connection pools which need to create initial database connections (which is slow...). That's why I've done all tests at least 3 times. When testing on the Oracle VM I've purged the dehydration store after every run in order to get the same initial situation for the tests.

The settings which increased the performance on my systems can of course be system specific. If other people have different experiences concerning some of the settings described in this post, it will be interesting to know. Also keep in mind that the settings I've found to improve performance on my system, might worsen the performance if other test scenario's are used. You should always test the settings on your own system to make sure they have the desired result and to confirm system stability is not effected. I've not tested in a clustered environment.

I have results concerning the performance improvements for reducing audit and log levels. Reducing audit and other logging however and can make it harder to debug problems. Putting BPEL process audit logging on 'Development' however in a production environment is in my opinion overkill and should be avoided or only used for a short period in order to solve issues.

Results

Locally optimized webservice calls

Locally optimized calls are faster then not locally optimized calls (non locally optimized calls have among other things SOAP overhead). I've not yet looked at this behavior when working in a cluster with a load balancer. The following might be interesting and would suggest local optimizations does not work through a load balancer if the server URL differs from the load balancer URL; https://blogs.oracle.com/rammenon/entry/is_local_optimization_kicking.It would be interesting to test this and try and make it work in clustered environments since the performance increase for using locally optimized calls is (not statistically tested) significant (about 25%).

Asynchronous callbacks

I've seen in my measures that asynchronous callbacks are a lot slower (about 5 times) then synchronous interactions. This is of course to be expected since correlation data needs to be saved and incoming messages need to be matched to the correlation data. If performance is important and processes are short-running, I'd advice to avoid asynchronous constructions.

nonBlockingInvoke

Setting the nonBlockingInvoke property on a partnerlink caused a decrease in performance. This is something I had not expected based on; http://docs.oracle.com/cd/E23943_01/core.1111/e10108/bpel.htm#ASPER99890. In my tests however, the services were fast and did little. It could be that if slower services were used, an improvement could be measured when using the nonBlockingInvoke option. I have however not tested this.

Tuning datasources (SOAINFRA schema)

My measures concerning the performance changes achieved when increasing the connection pool size of the SOALocalTxDataSource and SOADataSource are not consistent. On the Oracle VM I found that increasing the connection pool size, performance was improved. When trying this setting on a customer system however, performance was worsened. On the Oracle VM, a dedicated XE database is installed which is setup to allow plenty of sessions. On the customer system, the database was not only installed on a (most likely physically) different server but also not dedicated; several SOA Suite instances used the same database for their dehydration store. At the customer, the database sessions parameter (see for example https://forums.oracle.com/forums/thread.jspa?threadID=898395) was found to be limiting in the past. An educated guess is that this caused the performance decrease on that system.

One can conclude from the above that only looking at JDBC datasource settings on the Weblogic server is not enough to achieve consistent improvement across environments. One should also look at the database settings.

JVM settings

The following settings increased performance on all systems;

In setSOADomainEnv.sh

Default
PORT_MEM_ARGS="-Xms768m -Xmx1536m"
New
PORT_MEM_ARGS="-Xms1536m -Xmx1536m -Xgcprio:throughput -XX:+HeapDumpOnOutOfMemoryError -XXtlasize:min=16k,preferred=128k,wasteLimit=8k"
The following settings decreased performance (from http://docs.oracle.com/cd/E13150_01/jrockit_jvm/jrockit/geninfo/diagnos/bestpractices.html);
-XXaggressive
-XXcallProfiling

BPEL Engine tuning

Threads
I've tried and measured several settings related to the BPEL engine. There are 4 settings related to the number of threads used by the BPEL Engine;
DispatcherSystemThreads
DispatcherEngineThreads   
DispatcherInvokeThreads   
DispatcherNonBlockInvokeThreads

Increasing them did not lead to performance improvements

AuditStorePolicy
I've also tried playing with the AuditStorePolicy setting. This caused errors or worsened performance when combined with several of the other audit settings I've tried (for example in combination with deferred audit logging as described in the post referred to in the introduction). I got the best results leaving this set to syncSingleWrite.

Coherence
Setting the QualityOfService from DirectWrite to CacheEnabled led to worsened performance.

OneWayDeliveryPolicy
Setting this from async.persist to async.cache improved performance

Asynchronous audit logging
See http://javaoraclesoa.blogspot.nl/2012/06/increasing-bpel-performance.html. It improves performance but check the log files to see if the audit store does not encoutner unique key constraints.

I've not tried altering audit thresholds. This can also lead to performance improvements.

Process improvements

The process of using, monitoring and maintaining the SOA Suite installation is maybe even more important in increasing the performance then providing technical tweaks.

Based on the topics discussed in the Administrators handbook (https://beatechnologies.wordpress.com/2012/08/28/oracle-soa-suite-11g-administrators-handbook/) there are several activities which are considered to be part of the SOA Administrators responsibilities. This might be interesting for customers to consider. If for example a SOA Administrator has little background in application server maintenance or the SOA Suite in specific, there's a high probability project developers are more knowledgeable in some area's. This often leads to shift of responsibilities to developers.

Some of the tasks mentioned as part of the SOA Administrators job are listed below. These usually end up being done by developers.
- automating composite management and structuring composite deployments using ant scripts
- using and managing configuration plans
- administration of services, engines and MDS
- tuning SOA Suite 11g (operating system, application server, SOA infrastructure, database connections, dehydration store)
- monitoring (sometimes 'it's up and running!' is not enough...)

Other suggestions

The book contains several other suggestions for increasing performance. Interesting is also how the SOAINFRA database/schema can be tweaked. I've however not tested/measured this.

Since BPEL often uses services from different systems, tweaking those services can increase the performance of the process as a whole. Most noteworthy here are of course databases and JDBC settings.

Friday, September 21, 2012

Overview monitoring tools Oracle JRockit

Several monitoring options for the JRockit JVM are available. jps, jstat and jconsole are monitoring tools provided by the Oracle (previously Sun) JDK. Jps and jstat are commandline tools for obtaining information about running JVM’s. JConsole is a GUI suitable to monitor JVM’s supporting Java Management Extensions (JMX) such as JRockit. Oracle provides JVM monitoring software for JRockit (which can also be used for other JVM's); Mission Control which consists of several tools which can help in for example detection of memory leaks.

To monitor the JRockit JVM, it has to be started with the -Xmanagement option. This option is the same as using the following startup options for the Oracle (previously Sun) JVM:
 -Dcom.sun.management.jmxremote.port=7091
 -Dcom.sun.management.jmxremote.authenticate=false
 -Dcom.sun.management.jmxremote.ssl=false

Oracle (previously Sun) JVM tooling

Commandline tools

jps

The jps utility lists the virtual machines for the current user on the target system. The utility is useful in environments where the VM is started using the JNI Invocation API rather than the standard Java launcher. In these environments, it is not always easy to recognize the Java processes in the process list. The jps tool alleviates this problem.

The following example demonstrates the use of the jps utility. Enter jps on the command line, and the utility lists the virtual machines and process IDs for which the user has access rights

$ jps
16217 MyApplication
16342 jps

jstat

The jstat utility uses the JVM's built-in instrumentation to provide information on performance and resource consumption of running applications. The tool is useful for diagnosing performance issues, particularly issues related to heap sizing and garbage collection. jstatd is a daemon which can be used to use jstat to connect to a remote machine.

JConsole

If you start an application with JRockit in -Xmanagement mode, you'll be able to connect with Sun's jconsole tool to the JVM. See also in the introduction.

Overhead on the JVM for using JConsole is small; 3% to 4 %. See; http://weblogs.java.net/blog/emcmanus/archive/2006/07/how_much_does_i.html

Local monitoring

To monitor a local application, it must be running with the same user ID as jconsole.  The command syntax to start jconsole for local monitoring is:

jconsole [processID]
where processID is the application's process ID (PID). To determine an application's PID:

On Windows systems, use Task Manager to find the PID of java or javaw.
You can also use the jps command-line utility to determine PIDs.

For example, if you determined that the process ID of the application is 2956, then you would start jconsole as follows:

jconsole 2956

Both jconsole and the application must by executed by the same user name. The management and monitoring system uses the operating system's file permissions.

If you don't specify a process ID, jconsole will automatically detect all local Java applications, and display a dialog box that lets you select the one you want to monitor.

Remote monitoring

To start jconsole for remote monitoring, use this command syntax:

jconsole [hostName:portNum]
where hostName is the name of the system running the application and portNum is the port number you specified when you enabled the JMX agent when you started the JVM.

If you do not specify a host name/port number combination, then jconsole will display a connection dialog box enabling you to enter a host name and port number.

See below, Connection options under JRockit Mission Control for more information on the type of the connection.

JRockit Mission Control

Discovery options

Local

You can connect to locally discovered JRockits if the discovered JRockit is R27.1 or later and runs Java SE 5.0 or later.

JDP

JRockit instances are discovered automatically through JDP (JRockit Discovery Protocol) if the autodiscovery parameter is set to true (-Xmanagement:autodiscovery=true). The broadcast port for JDP can be specified in the JRockit Mission Control preferences and as a parameter upon starting the JVM.

Example parameters for starting JRockit (can be added in the Weblogic script which starts the relevant domain)
java -Xmanagement:ssl=false,authenticate=false,port=7091,autodiscovery=true

Connection options

Java Management Extensions (JMX) are accessed via RMI to obtain JVM instance information.

The JMX technology provides the tools for building distributed, Web-based, modular and dynamic solutions for managing and monitoring devices, applications, and service-driven networks. By design, this standard is suitable for adapting legacy systems, implementing new management and monitoring solutions, and plugging into those of the future. Starting with the J2SE platform 5.0, JMX technology is included in the Java SE platform.

RMI (remote method invocation) can be used to connect to JMX (MXBEANS or platform MBEANS) instances. In the references section there is a link to an example on how to implement this.

JRockit Mission control toolset 

Memory leak detection

BEA JRockit 1.4.2 (R26.2), BEA JRockit 5.0 sp1 and forward fully support the stand-alone Memory Leak Detector.

Memory leak detection is a tool which analyses the runtime of a JVM. Running the tool against a JVM has a small overhead cost most noticeable during garbage collection.

Memory leak detection can be used as followed;
- the Trend analyzer can be used to determine which objects have the fastest growth in bytes/second. The Trend analyzer can also help identifying targets which occupy a lot of heap space or have large numbers of instances
- once an interesting class has been identified, the Types tab can be used to identify causality and related objects
- to obtain more information about where the problem is occurring or which specific setting might cause it, specific instances can be analyzed of selected types and an allocation stack trace can be conducted. These cause more overhead to the JVM

JRockit Runtime Analyzer

The JRockit Runtime Analyzer consists of two parts. One is running inside the JVM and recording information about the JVM and the Java application currently running. This information is saved to a file which is then opened in the other part: the analyzer tool. This is a regular Java application used to visualize the information contained in the JRA recording file.

Recordings can be created from the Management Console, by using the jrcmd command line tool or by specifying recording options at the JRockit commandline.

On Windows, the commandline for jrcmd is as followed;

bin\jrcmd.exe <pid> jrarecording time=<jrarecording time>
filename=<filename>

The JRA tool provides the most extensive information on JVM usage, garbage collection, heap usage, etc. Since it is based on recording information during a set period and analyzing the data afterwards, timing becomes important if you want to use this tool to analyze runtime problems. During recording the overhead is small.

JRockit Management Console

The Management Console system and JVM behavior. It also has the option to set notifications for example, send an e-mail when a certain heap size is reached. Also the management console allows to increase the heap size at runtime to for example postpone an out of heapspace error. Also JRA recordings can be started as a result of for example high heap space usage to determine the problem.

The Management console has to be running in order to provide notifications, but using commandline options, it can be started in headless mode. Also using commandline options it can be set to connect to a JVM.

References

Jps and jstat
http://docs.oracle.com/javase/6/docs/technotes/tools/#monitor

JConsole documentation
http://download.oracle.com/javase/1.5.0/docs/tooldocs/share/jconsole.html

Oracle JRockit R28 documentation
http://www.oracle.com/technetwork/middleware/jrockit/documentation/index.html

BEA JRockit R27 documentation
http://www.oracle.com/technetwork/middleware/weblogic/documentation/weblogic-jrockit-089130.html

JMX Technology Home Page
http://www.oracle.com/technetwork/java/javase/tech/javamanagement-140525.html

Using RMI to connect to a JRockit JVM instance
https://blogs.oracle.com/pacogomez/entry/monitoring_jrockit_through_a_f

How much does it cost to monitor an app with jconsole?
http://weblogs.java.net/blog/emcmanus/archive/2006/07/how_much_does_i.html

Monday, September 3, 2012

JVM does not start on Windows Server 2008


A customer is using Windows Server 2008 64 bit and the Oracle JDK version 1.6.33 64 bit. Recently,  the following error occurred when a (any) Java application was started;

Problem signature:
Problem Event Name: APPCRASH
Application Name: java.exe
Application Version: 6.0.330.5
Application Timestamp: 4fed0a6a
Fault Module Name: jvm.dll
Fault Module Version: 20.8.0.3
Fault Module Timestamp: 4fed2ec7
Exception Code: c0000094
Exception Offset: 0000000000309132
OS Version: 6.1.7601.2.1.0.400.8
Locale ID: 1043
Additional Information 1: 9930
Additional Information 2: 993087b8a26c90b698b0aaa7c0c9a119
Additional Information 3: 45d8
Additional Information 4: 45d86e82cdfe3714a97bde810a82a78e

Even just starting java.exe -version caused this exception. De-installing all present JDK's/JRE's and installing different (32 bit and 64 bit) versions, did not solve this problem. When we downgraded to a JDK 1.5 version however, the problem did not occur anymore but using a version 1.5 JDK was not a viable option.

The  Exception Code: c0000094 is an INT_DIVIDE_BY_ZERO exception, so not much help there in clarifying the problem.

What we tried

There was no traceable change leading to this error.

We tried a clean install of the entire server (Windows reinstallation) and the JVM worked. Also after completely updating Windows, it still worked. We tried this locally with Virtualbox in a Virtual Machine instead of using the image/configuration of the machine on which the problem originally occurred. Multiple environments experienced the same problem. Also based on the below, our estimate is that this error is related to local (customer specific) policies (otherwise undoubtedly Google would have more information on this problem).

We encountered several errors when using Process Monitor; http://technet.microsoft.com/en-us/sysinternals/bb896645.aspx


What we saw was that in jvm.dll, different behavior started to occur. We could however not pinpoint the cause of this change of behavior. Decompiling the dll and running it with breakpoints on the server with Visual Studio, was not an option.


When we installed JRockit JDK, the problem was solved. To make the new JDK the default JDK used, several environment settings needed updating. We also use a Tomcat service which needed to be updated to use the new JDK.

Description

Install JRockit

First download the JRockit JDK;
Start the installer and specify the installation directory


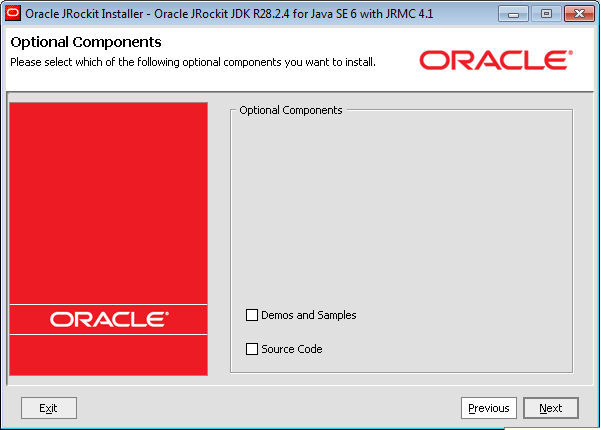
Don't install Demo's, samples and sources (unless of course you will use them)


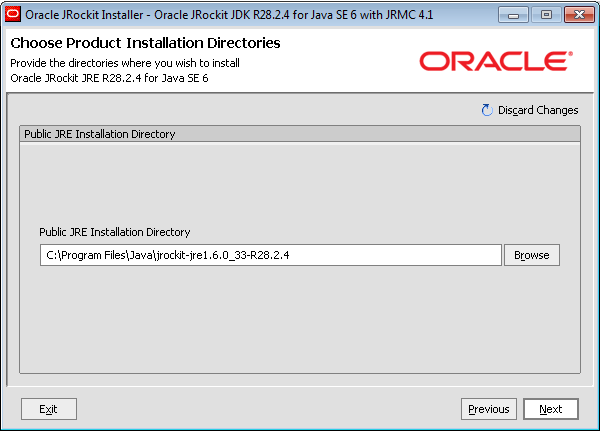
Install the public JRE (you might need the JRE some day and not the complete JDK)


Choose a directory to install the JRE


Update environment variables

Right mouse click the Computer icon, Properties (as you can see, I need a new laptop...).


Advanced system properties

Environment variables

Make sure no JAVA_HOME is present in the User variables. If JAVA_HOME is present under user variables, remove it.


If present, update and if not present, create the JAVA_HOME environment variable under System variables. Set it to be equal to the JDK installation directory. In this case; C:\Program Files\Java\jrockit-jdk1.6.0_33-R28.2.4-4.1.0. 
Update the Path System variable and set as the first entry the bin directory of the JDK. In this case; C:\Program Files\Java\jrockit-jdk1.6.0_33-R28.2.4-4.1.0\bin. Start a new command prompt (Start, cmd) and give java -version to test the Path  variable and the newly installed JDK.

Update Tomcat service

We use Tomcat 6 on the Windows 2008 server. When we changed the JDK, Tomcat wouldn't start anymore when we started it from the Windows Services screen. Tomcat usually autodetects the JDK present on the system based on the JAVA_HOME, but in case of JRockit, this auto setting wouldn't work.

The JVM can be specified manually though. See; http://tomcat.apache.org/tomcat-6.0-doc/windows-service-howto.html 

In case of JRockit, the following command updated the service to use the correct JDK;

tomcat6.exe //US//Tomcat6 --Jvm="C:\Program Files\Java\jrockit-jdk1.6.0_33-R28.2.4-4.1.0\jre\bin\jrockit\jvm.dll"

Tomcat6 here is the name of the service. The path to the jvm.dll file might differ depending on the location you specified when installing JRockit

Conclusion

When mysterious JVM errors start to occur when using Windows Server 2008, consider using JRockit and make sure the JVM is known to the programs using it.